Overview
The Plumb Funds proudly follow the Wisconsin Capital Management tradition of striving to produce solid risk-adjusted returns by buying quality companies who are participating or supporting secular changes in the market.
We also seek out companies that we believe are well-positioned to benefit from current market conditions with a goal of out-performing over the entire business cycle. We find them particularly attractive when they can be purchased at what we believe are depressed prices when compared to our estimates of value.
For the Plumb Balanced Fund, we believe that holding a diverse group of stocks moderated by an allocation to bonds as well holds the potential to provide competitive returns under different market environments. In seeking to achieve a better risk-adjusted return on its equity investments, the Fund invests in many types of stocks, including a blend of large, mid-sized and small company stocks. Our flexible approach to investing enables us to adapt to changing market trends and conditions and to invest where we believe opportunity exists.
Performance Plumb Balanced Fund
Morningstar Analysis
Morningstar is a leading provider of independent investment research, analyzing approximately 500,000 investment offerings worldwide.
As of 12/31/2025 based on risk-adjusted returns
| Star Rating | |||
|---|---|---|---|
| Overall Rating | 3 Years | 5 Years | 10 Years |
| Among 464 Allocation-50-70% Equity Funds |
Among 464 Allocation-50-70% Equity Funds |
Among 444 Allocation-50-70% Equity Funds |
Among 370 Allocation-50-70% Equity Funds |
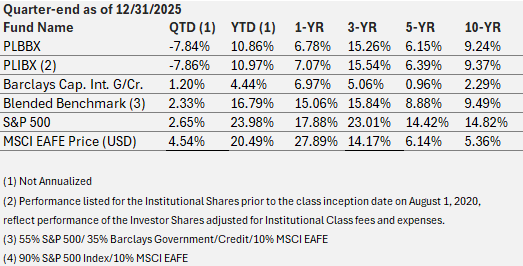
Average Annualized Returns %
Periods less than one year are not annualized
Inception 5/24/07

Expense Ratio: Investor share: Gross 1.53% Net 1.44%. Institutional share: Gross 1.28% Net 1.19%. The advisor has contractually agreed to waive fees through 7/31/2026. Investment performance reflects fee waivers. In the absence of these waivers, returns would be reduced. S&P 500 Index is an unmanaged market capitalization-weighted index based on the average weighted performance of 500 widely held common stocks. MSCI EAFE Index in an index intended to reflect the performance of major developed countries’ international equity markets, besides the United States and Canada. Blended Benchmark is made up of 90% S&P 500 index and 10% MSCI EAFE index. One cannot invest directly in an index.
| Calendar Year Returns % (10-years) | ||||||||||
|---|---|---|---|---|---|---|---|---|---|---|
| 2019 | 2018 | 2017 | 2016 | 2015 | 2014 | 2013 | 2012 | 2011 | 2010 | |
| PLBBX | 23.20 | -1.74 | 23.22 | 5.06 | -0.59 | 10.41 | 22.21 | 4.97 | -1.80 | 11.49 |
Performance data quoted represents past performance and does not guarantee future results. Investment returns and principal value will fluctuate, and when sold, may be worth more or less than their original cost. Current performance may be lower or higher than the performance quoted.
As of 12/31/2025, Morningstar rated the Funds as follows: Equity Fund 1, 2, 1, 1 for Overall, 3, 5, and 10 years among 1004, 1004, 936, and 755 Large Growth Funds; Balanced Fund 3, 5, 1, 3 for Overall, 3, 5 and 10 years among 464, 464, 444 and 270 Allocation-50%to 70% Equity Funds based on risk adjusted returns. The Morningstar RatingTM for funds, or “star rating”, is calculated for mutual funds, variable annuity and variable life subaccounts, exchange-traded funds, closed-end funds, and separate accounts with at least a three-year history. Exchange-traded funds and open-ended mutual funds are considered a single population for comparative purposes. It is calculated based on a Morningstar Risk-Adjusted Return measure that accounts for variation in a managed product’s monthly excess performance, placing more emphasis on downward variations and rewarding consistent performance. The top 10% of products in each product category receive 5 stars, the next 22.5% receive 4 stars, the next 35% receive 3 stars, the next 22.5% receive 2 stars, and the bottom 10% receive 1 star.
The Overall Morningstar Rating for a managed product is derived from a weighted average of the performance figures associated with its three, five, and 10-year (if applicable) Morningstar Rating metrics. The weights are: 100% three-year rating for 36-59 months of total returns, 60% five-year rating/40% three-year rating for 60-119 months of total returns, and 50% 10-year rating/30% five-year rating/20% three-year rating for 120 or more months of total returns. While the 10-year overall star rating formula seems to give the most weight to the 10-year period, the most recent three-year period has the greatest impact because it is included in all three rating periods.
The Morningstar Rankings represent a fund’s total-return rank relative to all funds that have the same Morningstar Category. The highest percentile rank is 1 and the lowest is 100. It is based on Morningstar total return, which includes both income and capital gains or losses and is not adjusted for sales charges or redemption fees.
© 2025 Morningstar, Inc. All rights reserved. The information contained herein: (1) is proprietary to Morningstar and/or its content providers; (2) may not be copied or distributed; and (3) is not warranted to be accurate, complete, or timely. Neither Morningstar nor its content providers are responsible for any damages or losses arising from any use of this information. Past performance is no guarantee of future results.
Distributions
Fees and Expenses
FUND INFO as of 12/31/2025
SYMBOL: PLBBX, PLIBX, PLABX
CUSIP: 976586107, 976586305, 976586503
MIN /SUBSQ/IRA: $2500/$1000/$100
AUM: $64.8 mil
